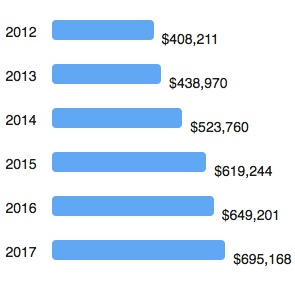
The real estate market is constantly changing. The single family market statistics for Somerville MA 2017 2nd quarter is proof that although there are overall trends, all markets will fluctuate up and down. In the second quarter of this year, there was a slight drop in sales prices, but not enough to cause much concern.
Somerville MA single family Property Prices
For the 2nd quarter 2017, single family homes in Somerville MA had an average sales price of $798,677. In 2016, that average was $807,579. This would be the second year in a row that prices have slightly declined in the second quarter. Does this mean that home prices have finally leveled off? Not necessarily. Price is always a reflection of supply versus demand. Let’s take a look at supply.
| 2017 | |
| 2016 | |
| 2015 | |
| 2014 |
Listings Sold in Somerville MA
There were significantly more listings sold in the 2nd quarter of 2017 than the previous 3 years. With more options available, this may explain why prices leveled off a bit. It will be interesting to see what the statistics on this look like for the rest of 2017.
| 2017 | |
| 2016 | |
| 2015 | |
| 2014 |
Somerville MA 2016 2nd Quarter Average Marketing Time
Although supply was greater and average selling prices dropped slightly, homes sold fairly quickly this year compared to previous years. Average days on market was only 32 days. This is compared to 51 days in the second quarter of 2016.
| 2017 | |
| 2016 | |
| 2015 | |
| 2014 |
Single Family Market Statistics For Somerville MA 2016 2nd Quarter
For additional single family market statistics for Somerville MA 2016 2nd quarter or details for nearby neighborhoods, please contact Carl Garcia at at Eagle Trust Insurance. These figures were pulled from the Mass. MLS Property Information Network, Inc. It is meant to provide a general understanding of the real estate market, is not guaranteed accurate, and may not necessarily encompass every single single family transacted in Somerville.

 Somerville MA Condo Home Sale Prices For 2nd Quarter 2017
