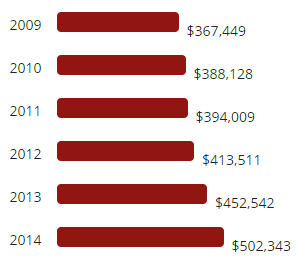
The Somerville MA single family real estate report for 3rd quarter 2014 below details average home prices, number of properties sold, and average days on market for the previous several years.
Somerville MA Single Family Real Estate Prices
3rd Quarter Price of Homes Closed
Somerville MA average sales price for the 3rd quarter decreased -14.16 % from $605,297 to $519,586. Prior to that, it increased 12.75% from $536,839 to $605,297. Prior to that there was a 12.34% change. This most recent decline is a change from the trend from the previous few years.
| 2009 | |
| 2010 | |
| 2011 | |
| 2012 | |
| 2013 | |
| 2014 |
3rd Quarter Volume Of Homes Sold
The Volume of homes sold in Somerville MA for the 3rd quarter decreased -21.62% from 37 to 29. In the time frame before that, it increased 32.14% from 28 to 37. Prior to that was a 33.33% change. This most recent decline is a change from the pattern from past years.
| 2009 | |
| 2010 | |
| 2011 | |
| 2012 | |
| 2013 | |
| 2014 |
3rd Quarter Average Listing Time Frame
The Average listing time frame in Somerville MA for the 3rd quarter increased 88% from 25 to 47. In the time frame before that, it decreased -46.81% from 47 to 25. Prior to that was a -33.8% change. This most recent increase is a shift in trend from previous years.
| 2009 | |
| 2010 | |
| 2011 | |
| 2012 | |
| 2013 | |
| 2014 |
About the Somerville MA Single Family Real Estate Report For 3rd Quarter 2014
This Somerville MA single family real estate report for 3rd quarter 2014 is provided as an overview and may not include all sales (such as private sales). These statistics were received from third parties including county records and the Massachusetts MLS Property Information Network, Inc. Statistics above cover only the third quarter of each year (and not the entire year). Follow our blog for statistics on additional time frames and for an end of year summary.

 How Car Insurance Needs May Change with Age

